MARKET CLOSED
00:00:00

Russia Market Overview

Real-time MOEX quotes

Pick a stock, review its price chart over any period, and track today's top gainers and top losers.

—

— ₽

—
Loading…
AssetPrice, ₽+/- %
Loading…

Top gainers

AssetPrice, ₽+/- %
No data for this period.

Top losers

AssetPrice, ₽+/- %
No data for this period.

Source: MOEX ISS

Explore the platform

Jump to what matters

Stock Market

Institutional-quality fundamental research

Making it possible to understand any company's business model, risk profile, and competitive position in minutes, not hours. The place you open before you decide, not after.

Not a tool for speculation. A tool for conviction.

Fundamental Research

AI-synthesized company profiles with business model summaries, risk factors, and operational segments — ready in minutes, not hours.

Live MOEX Pricing

Real-time quotes, volumes, and market caps streamed from MOEX ISS, refreshed continuously and cached for performance.

Sector Benchmarking

Automated peer comparison across market cap, volatility, and volume so you see where every name sits in its sector.

Sentiment Scoring

Every news article tagged with directional sentiment and market impact context — cutting through the noise before you commit.

The Core Problem We Solve

What exists today

Brokerage apps show price charts and order execution — no business context

What RUBL provides

Business model summaries, sector exposure, and operational segments in one view

What exists today

Fundamental data is scattered across annual reports, news sites, and forums

What RUBL provides

AI-synthesized company profiles pulled from structured sources with extra live news scores

What exists today

Competitor analysis requires manual research across multiple platforms

What RUBL provides

Automated sector peer benchmarking with market cap, volatility, volume comparison and risk management

What exists today

News sentiment is unscored and overwhelming

What RUBL provides

Every news article tagged with directional sentiment (bullish/bearish/neutral) and market impact context.

Stock Market

Live equities coverage across every sector

96

Listed Stocks

MOEX equities

96

With Quotes

live pricing

6

Sectors

covered

—

Market Cap

aggregate

OTC Market

Over-the-counter, made legible

The over-the-counter (OTC) market is where securities trade directly between participants, outside the major exchanges. It opens the door to private and off-exchange instruments — but historically at the cost of thin liquidity, scarce data, and opaque pricing. We rebuild that experience around research, clarity, and disciplined time horizons.

Off-Exchange

Trades are negotiated directly between parties rather than on a centralized exchange order book — access to instruments that never list publicly.

Research-First

Thinly traded names demand real diligence. Every instrument is paired with fundamental analysis so you understand the business before you commit.

Lock-Up Horizons

Positions are held over 1, 3, or 5-year windows — aligning capital with the long settlement and maturity cycles typical of private markets.

Transparent Pricing

Indicative quotes, market cap, and sector context are surfaced upfront, replacing the opacity that usually surrounds over-the-counter deals.

OTC Market

Live coverage across every OTC sector

118

OTC Instruments

off-exchange

118

With Quotes

live pricing

6

Sectors

covered

₽15.7T

Market Cap

aggregate

Commodities Market

Live commodity & benchmark signals

Real-time pricing across the commodity complex — energy benchmarks like Brent, key currency crosses, and headline market indices. These signals refresh continuously to track the macro backdrop that drives valuations across every sector we cover.

Energy Benchmarks

Brent crude and other energy benchmarks tracked in real time — the macro backdrop that drives valuations across every sector.

FX Crosses

Key currency pairs including USD/RUB, EUR/RUB, and CNY/RUB sourced from the Central Bank — essential context for ruble-denominated assets.

Headline Indices

MOEX headline indices alongside crypto and precious metals — a single pane for the signals that move Russian markets.

Continuous Refresh

Signals refresh every few minutes with live indicators — so the macro picture stays current without manual lookups.

Commodities Market

Macro signals that drive sector valuations

19

Live Signals

streaming now

6

Asset Classes

FX, energy, indices

6

Data Sources

MOEX, CBR, Yahoo

5 min

Refresh

update cycle

Physical Assets

Real-world infrastructure behind the market

Beyond shares and prices sits the physical layer — refineries, gas plants, oil and gas fields, wells, storage, terminals and pipelines. Each asset links back to the company that owns it, connecting financial exposure to the tangible facilities that generate it.

Refineries & Plants

Oil refineries and gas processing plants — the downstream capacity that turns raw hydrocarbons into marketable fuels and feedstock.

Fields & Wells

Upstream oil and gas fields, wells and offshore platforms — the production base that feeds every company's output.

Terminals & Ports

Export terminals, LNG facilities and sea ports — the logistics gateways where volumes reach global markets.

Storage & Pipelines

Underground storage and trunk pipelines — the network that balances supply and moves product across the country.

Physical Assets

The real-world infrastructure behind the market

159

Physical Assets

mapped nationwide

16

Asset Types

plants to pipelines

155

Operational

live facilities

6

Sectors

covered

Why Long-Term Investors Choose RUBL Terminal

Every feature answers a variant of the most important investor question: what is this business?

Business Understanding

“What does this company actually do?”

Business model summary, sector classification, key facts in 2–3 minutes

Structural Clarity

“Is this a diversified, sustainable business?”

Subsidiary tree, business lines, and operational segments displayed visually

Risk Assessment

“What could go wrong — and how exposed are they?”

Geographic markets, export dependence, sector concentration, market volatility, risk exposure

Competitive Position

“Are they a leader or a follower in their sector?”

Competitor benchmarking by market cap, volatility, trading volume, and risk score

News Context

“What is happening around this company right now?”

Directional news analysis (bullish/bearish/neutral) with market impact filtering

Investment Conviction

“Is this worth deeper research and capital?”

Combined view that answers all of the above in a single session

The Research Session — What You Experience

Open a company profile, review the business structure, check sector and geographic exposure, scan 20 recent news items with directional tags — and leave with a clear view of whether the company deserves a position in your portfolio. Total time: under 3 minutes.

Data partners & market sources

Built on trusted market data

MOEX
Exchange data
FMP
Market fundamentals
World Bank
Global benchmarks
Argus
Commodity assessments
SGX
Futures markets
Yahoo Finance
Market data
MOEX
Exchange data
FMP
Market fundamentals
World Bank
Global benchmarks
Argus
Commodity assessments
SGX
Futures markets
Yahoo Finance
Market data

Core Functional Modules

Eight integrated modules for complete company understanding

Asset Context

Company description, founding date, HQ, employee count, website, key facts, and sector classification — the business in plain language.

Market Context

Macro-level context specific to the asset category (e.g., China demand dynamics for metals, sanctions exposure for energy companies).

Subsidiaries

Structured view of companies owned by or affiliated with the selected asset — critical for understanding conglomerate risk and diversification.

Competitor Analysis

Sector peer benchmarking on market cap, daily change, volatility, and trading volume. Plan-gated: 1 competitor (FREE), 3 competitors (INVESTOR/PRO).

News Intelligence

Curated articles filtered by asset with directional tagging (bullish/bearish/neutral). Identify market trends and sentiment shifts affecting your holdings.

Watchlist

Persistent asset tracking with notes and tier-based limits. Track time spent analyzing each asset.

Alerts

Price and signal threshold alerts. INVESTOR and PRO tiers only. Get notified when market conditions or significant events occur.

For Business Owners

Not just for investors. If you own or manage a company, add it to our platform and gain competitive intelligence that helps you outperform your rivals.

Add Your Company

Get listed and unlock full platform capabilities

Business owners can request to add their companies to our stock list. Once approved, you get access to all platform features specifically tailored for competitive analysis and strategic planning.

See how investors perceive your business
Monitor news coverage and sentiment about your brand
Get alerts when competitors make moves
Request Company Listing

Competitive Intelligence Features

Compare with Nearest Competitors

Instantly benchmark against similar companies in your sector. See market cap differences, volatility patterns, and trading volume comparisons.

Track Market Dynamics

Monitor how your position changes relative to competitors over time. Identify trends before they become obvious to the market.

Analyze Competitor Strategies

Study what drives competitor success through news analysis, sector exposure data, and business structure insights. Adapt winning approaches.

Stay Ahead or Catch Up

If you're lagging behind, our platform shows exactly where competitors excel. Use these insights to update products, adjust pricing, or pivot strategy.

Business Intelligence, Not Just Market Data

Turn competitor analysis into actionable strategy. Know where you stand, where they're heading, and how to get ahead — all in one platform.

Contact Us

Product Roadmap

Four-phase development trajectory building a full-spectrum research and market intelligence platform across stocks, OTC, commodities, and physical assets

Phase 1Done
  • Stocks Market section with live MOEX pricing and sector breakdowns
  • OTC Market insights and pricing visibility
  • Commodities Market signals for Brent, FX, and headline indices
  • Physical Assets market linking companies to real-world infrastructure
  • Cross-market navigation across every sector
Phase 2In Progress
  • Physical Assets expanded across every sector — refineries, fields, terminals, pipelines, plants
  • Standardized market sections with clear headings and stats
  • Integrated Problem & Solution research content inside the markets
  • Expanded FAQ grouped by Stocks, OTC, Commodities, and Physical Assets
  • Category listing pages for stocks, OTC, commodities, and infrastructure
Phase 3Planned
  • In-depth research pages and per-asset investment theses
  • Cross-market intelligence linking companies, commodities, and physical assets
  • Sector deep-dives with supply-chain and ownership mapping
  • Research watchlists and market signal alerts
Phase 4Vision
  • Trade-flow intelligence for physical assets — throughput, utilization, vessel and port data
  • Personalized market intelligence and thematic screening
  • Multilingual research experience across all markets
  • Open data and API access for researchers and analysts

FAQ

Stocks Market

How current are stock prices?

Stock quotes and market caps are streamed from MOEX ISS and refreshed continuously; we cache for performance but surface near-real-time pricing for decision-making.

Which stocks are covered?

We cover all MOEX-listed equities relevant to each sector. Coverage and sector breakdowns are listed in the Stocks Market section and linked from each category page.

Can I research a company in depth?

Yes — the platform provides AI-synthesized company profiles, fundamental metrics, and news sentiment so you can build a complete research picture of each company.

OTC Market

What makes OTC different from exchange trading?

OTC instruments are quoted away from the main exchange and often involve lower transparency and liquidity. We surface indicative quotes, sector context, and research to reduce opacity.

How reliable are OTC quotes?

Indicative quotes are a research reference point rather than a firm price. We show live quotes where available and tag which instruments have confirmed pricing.

How does OTC research connect to the rest of the platform?

OTC instruments are linked to their issuing companies, sectors, and related physical assets, so you can move from an OTC quote to the underlying business and infrastructure in a few clicks.

Commodities Market

Which commodity signals do you track?

We stream energy benchmarks (Brent), FX crosses (USD/RUB, EUR/RUB), headline indices, and key metals — all visible in the Commodities Market section.

How often do commodity signals refresh?

Signals refresh every few minutes — the UI indicates last-updated times so you always know the recency of the data.

How do commodity signals fit into my research?

Commodity benchmarks and FX context are surfaced alongside companies and physical assets so you can assess the macro drivers that shape each sector.

Physical Assets

What is the Physical Assets market?

It maps public companies to the real-world infrastructure they operate — refineries, fields, terminals, pipelines, plants, data centers, and more — so you can research the tangible assets behind each business.

Which sectors are covered?

Physical Assets span every sector on the platform — Oil & Gas, Metals & Mining, Industrial, Agriculture, Banking, and IT & Digital — each with its own infrastructure listing and detailed asset profiles.

What can I learn from an asset profile?

Each profile shows the operator, location, capacity, status, and multi-year throughput, plus recent developments and a link to the owning company — connecting infrastructure to market research.

Ready to understand Russian markets?

Join investors who make decisions based on fundamentals, not speculation. Start with the free plan — no credit card required.

2–3 minutes to understand any company · 30+ news/day · AI-powered company profiles

Earlier Coverage

Market narrative history.

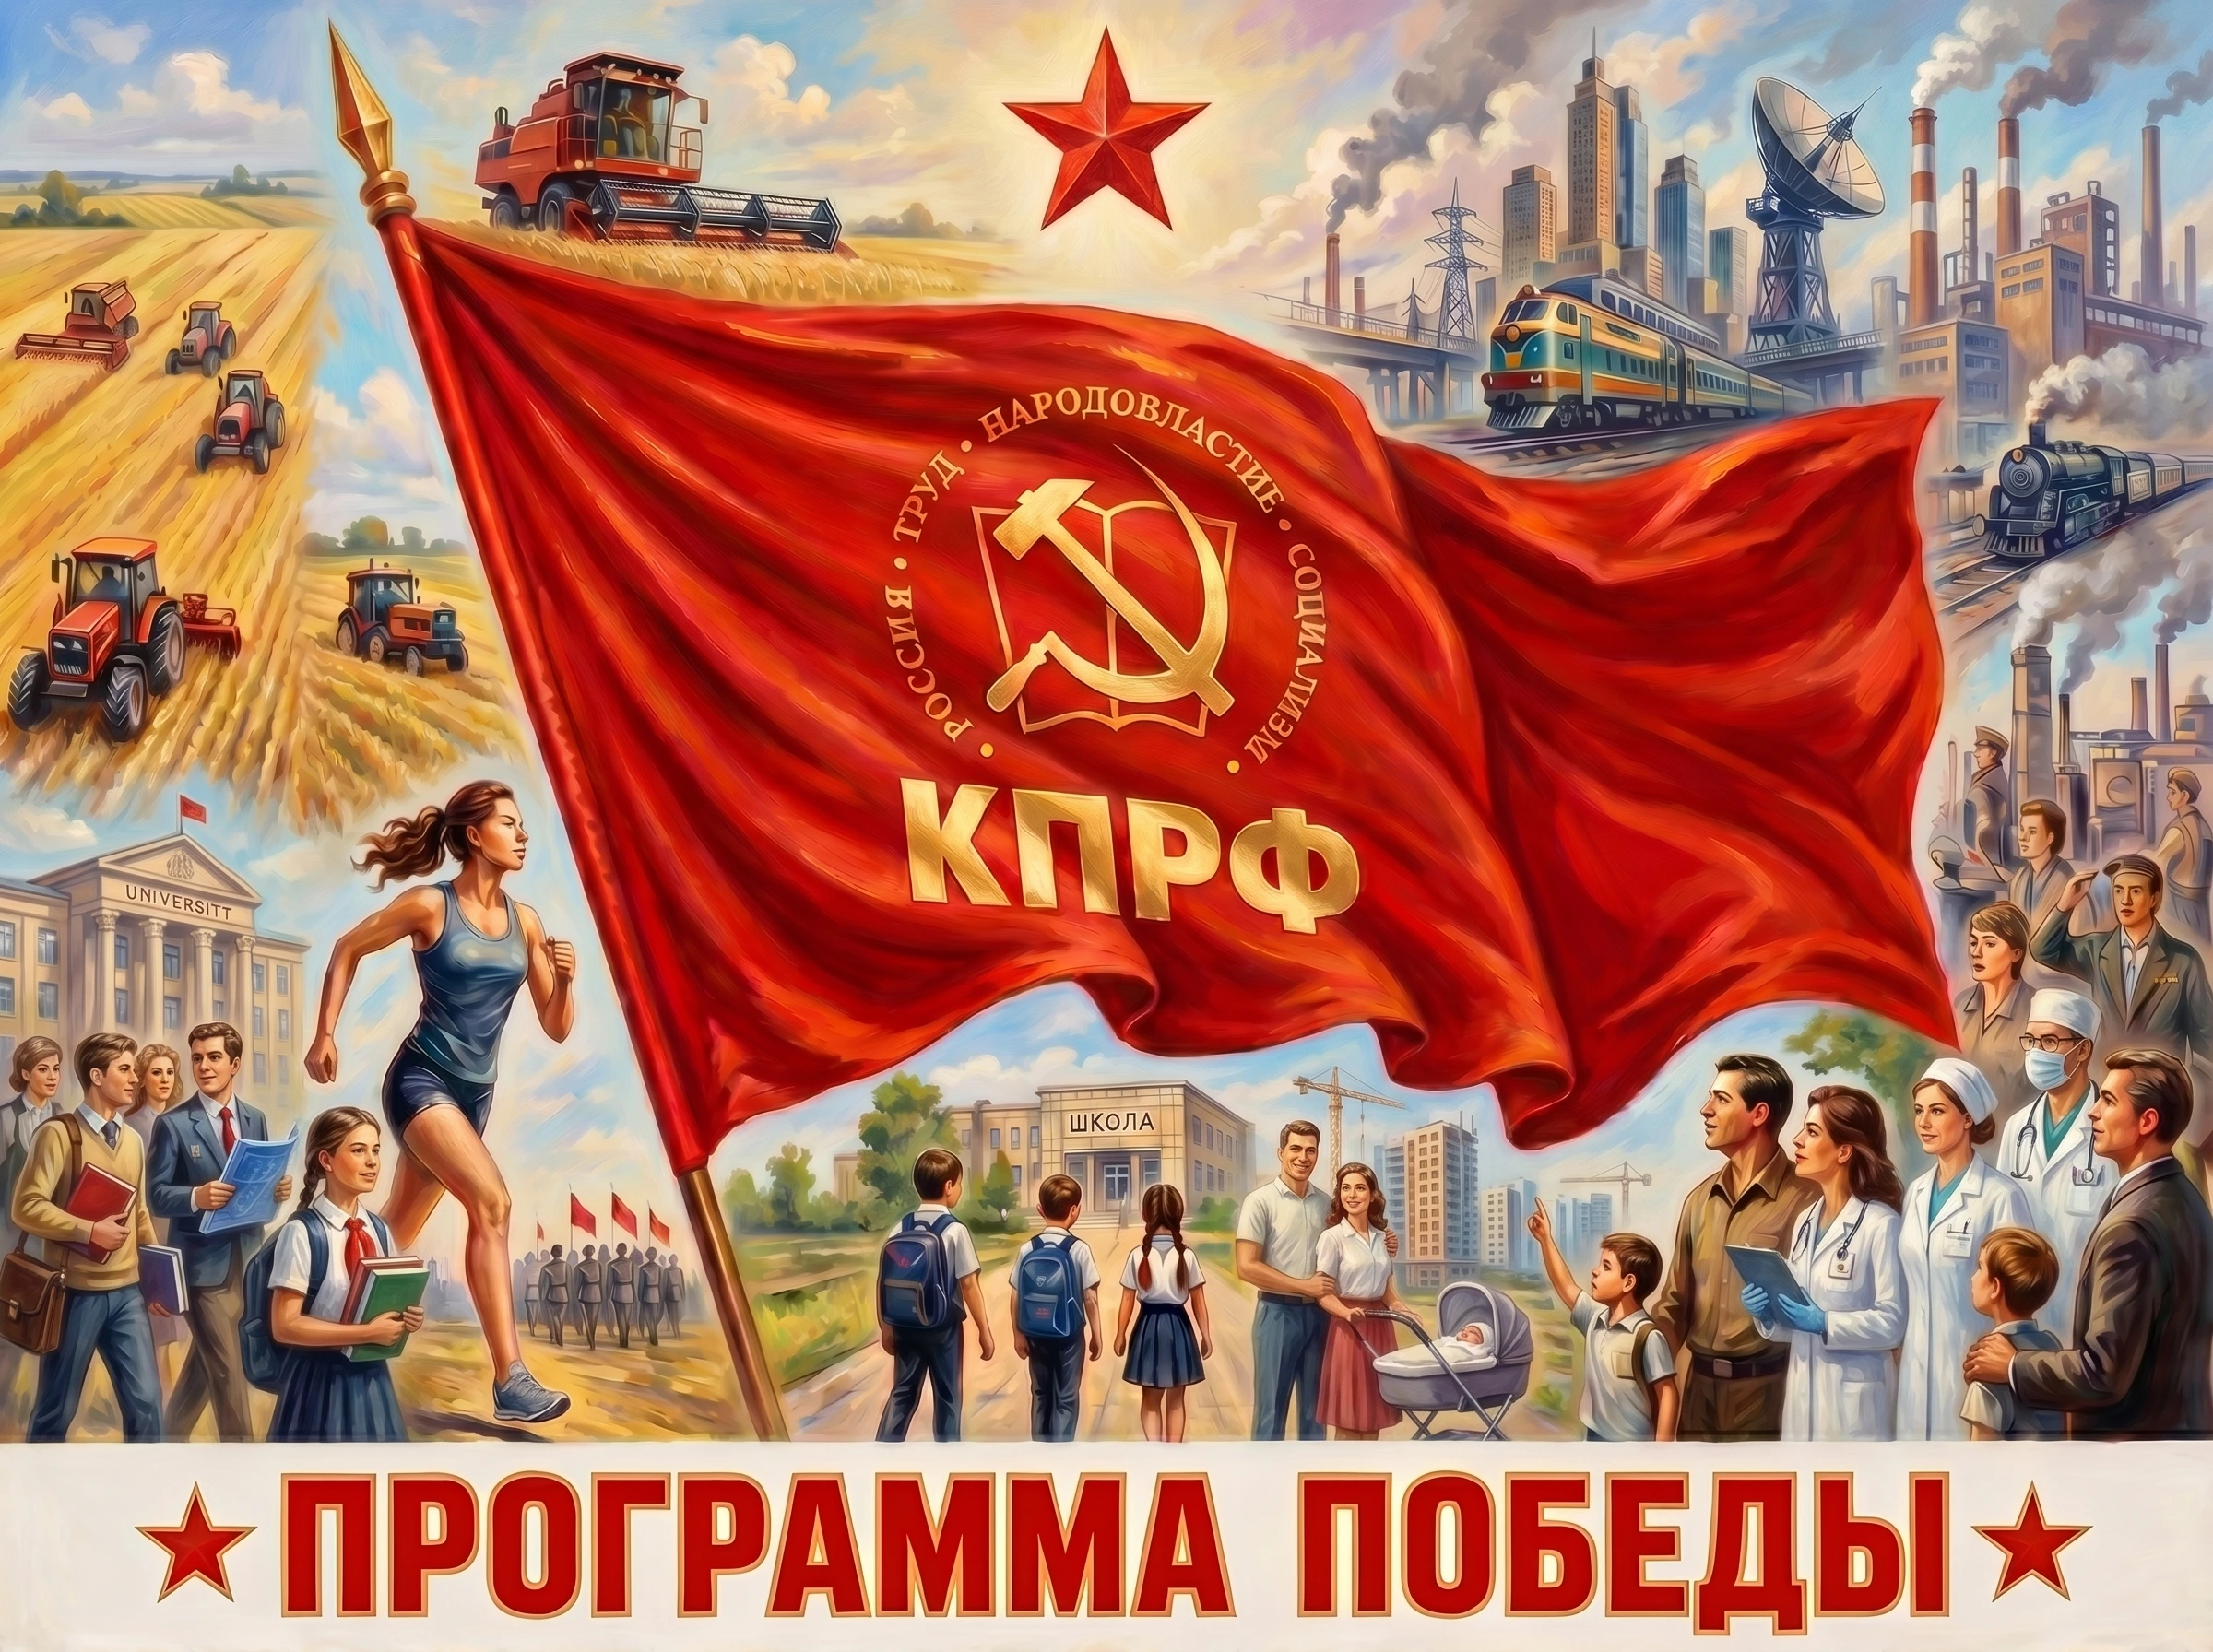
Russia KPRF's 'Program of Victory': The Economic Proposals Behind the Communist Electoral Platform
Sep 4
Editorial Analysis

Russia KPRF's 'Program of Victory': The Economic Proposals Behind the Communist Electoral Platform

The Communist Party of the Russian Federation (KPRF) has detailed its election platform for the 2026 State Duma elections, presenting a series of interconnected economic proposals that aim to reshape fundamental aspects of Russia's economic model through state intervention, nationalization, and progressive fiscal policies.

Read ->
Russia's 2025 GDP Revealed: $1.09 Trillion
Apr 22
Editorial Analysis

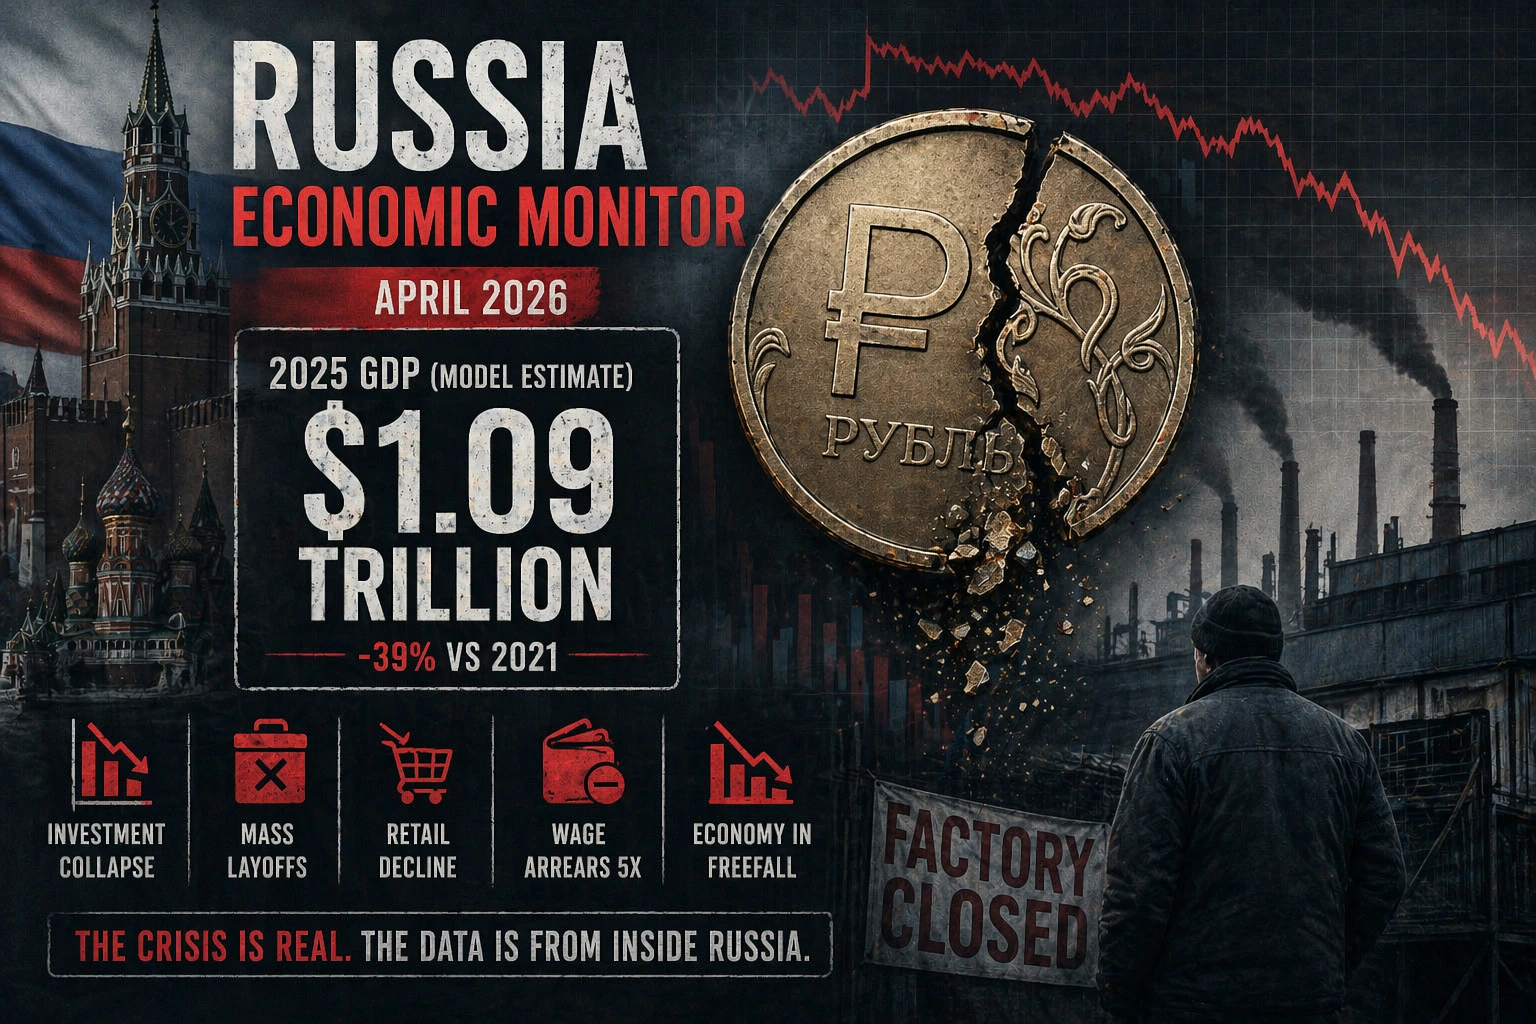
Russia's 2025 GDP Revealed: $1.09 Trillion

Russia’s wartime economy has become increasingly difficult to measure through headline statistics alone. Large-scale state spending, sanctions distortions, military-industrial prioritisation, exchange-rate volatility and changing reporting standards have all reduced the transparency of traditional macroeconomic indicators. As a result, alternative analytical frameworks are often used to understand the underlying structure of output.

Read ->
Санкции за войну против Украины: Белоруссия потеряла $12–18 млрд
Apr 7
Editorial Analysis

Санкции за войну против Украины: Белоруссия потеряла $12–18 млрд

Санкции за войну против Украины оказали реальный экономический эффект: Белоруссия потеряла $12–18 млрд через падение экспорта, рост логистических затрат, финансовые ограничения и почти полное сворачивание притока иностранных инвестиций, что привело к ослаблению ключевых отраслей

Read ->

Russian market snapshot

MOEX · Delayed quote · RUB · Updated Oct 9, 2026, 10:36 PM UTC

MOEX Russia Index (IMOEX) 2,401.80 +3.87% · US Dollar / Ruble (USD/RUB) 84.90 -0.60% · Chinese Yuan / Ruble (CNY/RUB) 12.67 -0.46% · Brent Crude Oil (BRENT) 8,866.11 +0.14%.